Playlist features
Spot problems before they become patterns. Use the heat map to identify screen downtime during specific days, or hourly periods.
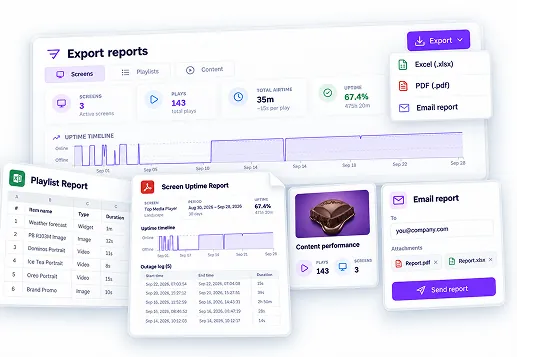
See screen uptime, playlist air-time and proof of play for every file, in one place. Then export a branded PDF or Excel report and email it to anyone in a click.
 Harbour Hotel Dashboard
Play Tutorial
2
SJ
Sarah Jacobs
Harbour Hotel
Reports
Operational analytics for your screens, playlists and content.
Status timeline
Offline OnlineEach cell represents one hour on that day for that screen.
Downtime / outage log
3 incidentsSummary
Rooftop Bar ONLINE
98.4% uptime · 22d 14h · 1 incident · 01 Oct 2026 – 23 Oct 2026
Uptime timeline
Outage log (1)
Sydney Harbour.jpg
1,284 plays · 5h 21m · 6 screens · 3 playlists

Plays by day
Screens that played this (6)
Exporting content report
Bundling plays, airtime and proof of play into your file.
Email this report
Send Content report - Sydney Harbour.jpg as a PDF to anyone.
From Sarah Jacobs · Harbour Hotel
Reply-to
content-report_2026-10-01_to_2026-10-23.pdf
Recipient email
Message (optional)
Add a short note for the recipient…
Playback report
Content Report
Sydney Harbour.jpg
Reporting period
01 Oct – 23 Oct 2026
23 days · full days · Africa/Johannesburg
 Reports
SJ
Status timeline
Offline OnlineEach cell represents one hour on that day for that screen.
Rooftop Bar ONLINE
98.4% uptime · 22d 14h · 1 incident · 01 Oct 2026 – 23 Oct 2026
Uptime timeline
Outage log (1)
Sydney Harbour.jpg
1,284 plays · 5h 21m · 6 screens · 3 playlists
Screens that played this (6)
Exporting content report
Bundling plays, airtime and proof of play into your file.
Email this report
Send Content report - Sydney Harbour.jpg as a PDF to anyone.
From Sarah Jacobs · Harbour Hotel
Reply-to
content-report_2026-10-01_to_2026-10-23.pdf
Recipient email
Message (optional)
Add a short note for the recipient…
Playback report
Content Report
Sydney Harbour.jpg
Reporting period
01 Oct – 23 Oct 2026
23 days · full days · Africa/Johannesburg
Screen Analytics
Monitor screen performance and quickly identify downtime, outages and connectivity issues across your network.
Playlist Analytics
See how your playlists are performing, including playback activity, frequency and performance across individual screens or groups.
Content Analytics
Verify exactly when, where and how often your content played, with detailed playback records for reporting and accountability.
From flexible filters to branded exports and emailed reports, get the insights you need in the format that works for you.
Spot problems before they become patterns. Use the heat map to identify screen downtime during specific days, or hourly periods.
Playlist features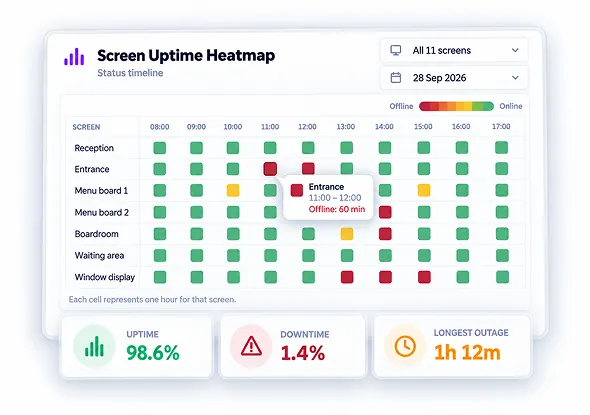
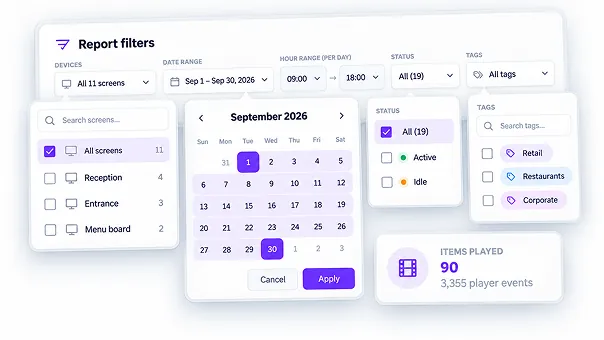
Find exactly what you need with flexible report filters. Narrow your results by screen, content, tags or date range, focus on specific times of day or operating hours, and filter by active or expired content. Get a clear view of the details that matter to you.
Export your reports to Excel or PDF, customise each one with your branding and have it delivered straight to your inbox. Easy to share, ready to present and made to look like yours.
Spot problems before they become patterns. Use the heat map to identify screen downtime during specific days, or hourly periods.
Spot problems before they become patterns. Use the heat map to identify screen downtime during specific days, or hourly periods.
Keep an eye on every screen from one live dashboard. View our extensive screen management features page.
Schedule a call with a team member, there are no dumb questions and happy to guide you.
Join the businesses already running their screens on Imagine. Register in minutes, or book a demo and we'll show you around.